Perf monitor
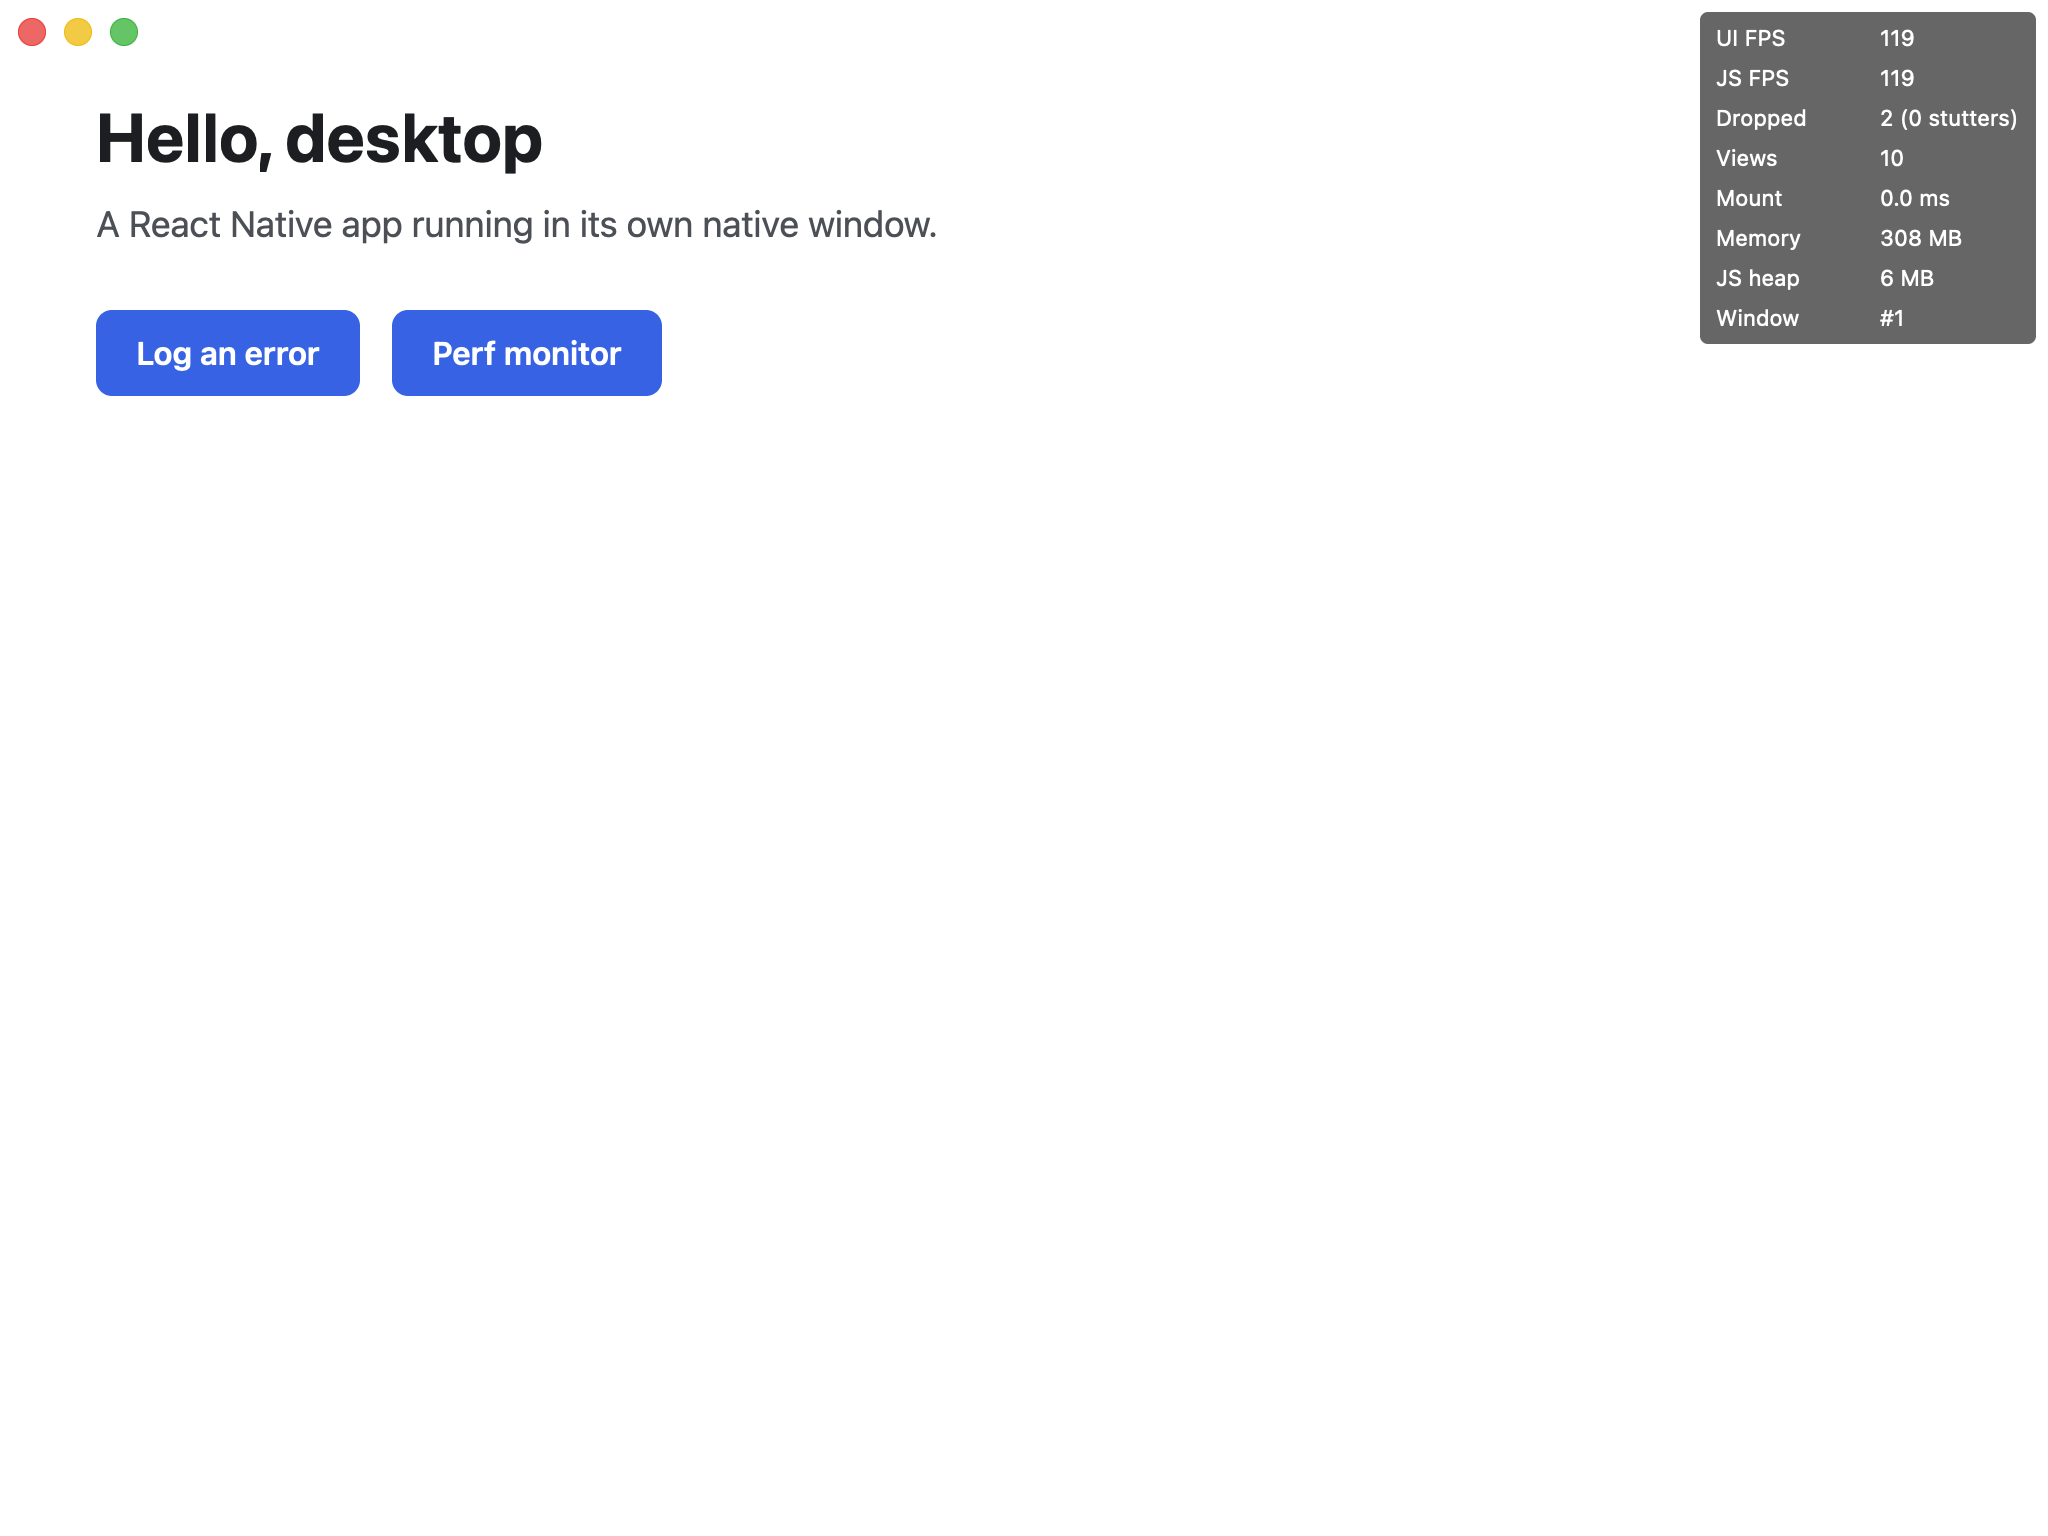
The perf monitor is an overlay with frame rates and memory use. It is painted by the renderer above every window, so it does not compete with the app it measures. It is also available from the dev menu.
React TSX
import { PerfMonitor } from '@react-native-gpui/core/desktop';

await PerfMonitor.setEnabled(true);
Methods
| Method | Description |
|---|---|
PerfMonitor.setEnabled(on) | Shows or hides the overlay. Resolves with the new state. |
PerfMonitor.isEnabled() | Whether the overlay is showing. |
PerfMonitor.toggle() | Switches it, and resolves with the new state. |
PerfMonitor.getMetrics() | Resolves with the current PerfMetrics. |
Metrics
| Field | Description |
|---|---|
enabled | Whether the monitor is on. |
uiFps | Frames the renderer drew in the last second. |
jsFps | Tasks the JavaScript thread ran in the last second, one posted per frame. |
memoryBytes | Memory used by the app. |
jsHeapBytes | Bytes the JavaScript engine reports as allocated. 0 when the engine does not say. |
droppedFrames | Display refreshes without a new frame since the monitor was enabled. |
stutters | The number of times four or more frames were dropped in a row. |
mountedViews | The number of views currently mounted. |
lastMountMs | How long the last mount took, in milliseconds. |
The JavaScript frame rate is measured natively: the host posts a task to the JavaScript thread each frame and counts the ones that ran, so the measurement does not add work to the thread it measures.